Table of Contents:
- Service History Report Page
- Approved vs. Pending Record
- Breakdown of a Service History Record
- Edit a Service History Record
- Create a Manual Record
- Viewing Your Log
- Set your PDF field configuration
- Customize Column Display
- Column Available
- Export Options
- Using Search Filters
- Exception Report
- Time zones in Service History
- Service History → Billing Report Workflow
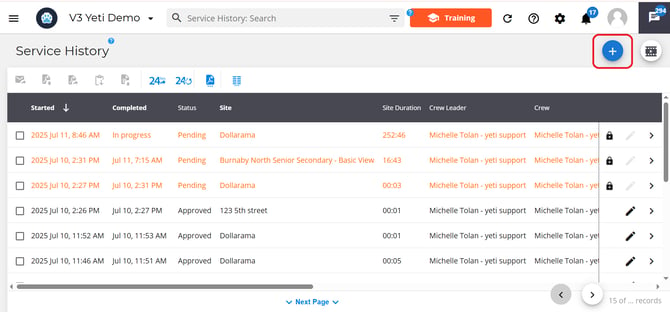
Service History Report Page
To access the service history page, select Service at the end of the navigation bar.

Approved vs. Pending Record
Records that have been approved or rejected off the dispatch page will appear in black.

Records that are still pending approval or rejection off the dispatch page will appear in orange.

Breakdown of a Service History Record
Each record in the report represents one site that was serviced. Select a record to open it up.

A pop-up will appear with a list of the following information about the site that was serviced:
- Site information

- Client and Sub-Contractor

- Timeframes

- Weather Condition

- Notes

- Billing information

- Photos Before and After

- Operators

- Services infomation

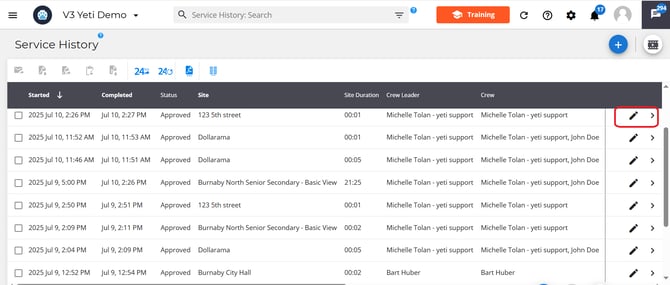
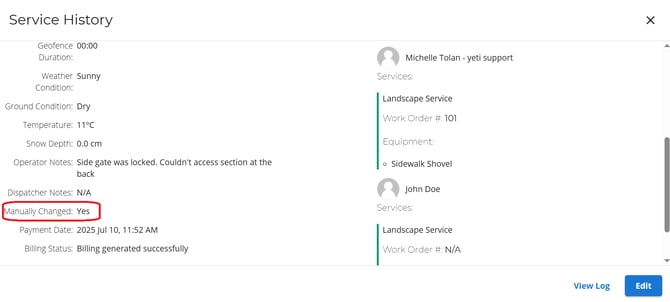
Edit a Service History Record
You can edit a record by either:
- Selecting the edit button in the pop-up
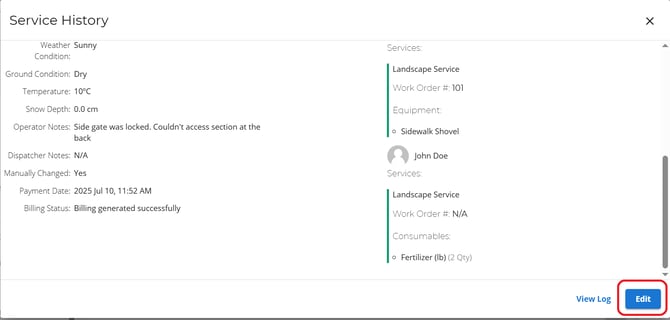
- Selecting the pencil icon at the end of a record.
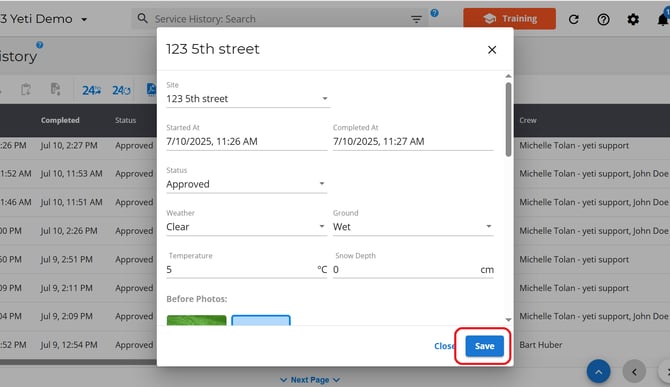
Once you have finished updating the record, click save.
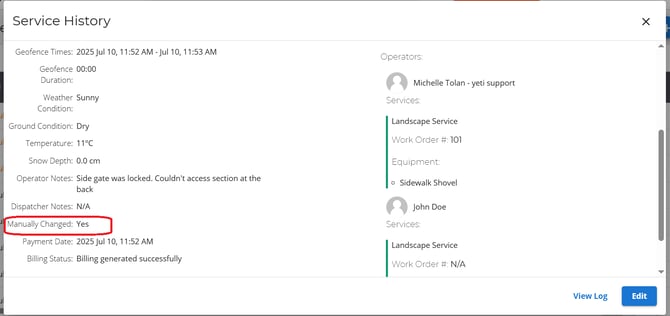
The record will note that a manual change has been made.
Create a Manual Record
If an operator forgets to service a site on the mobile app, you can create a manual record.
Select the blue (+) Button.
Select a site and enter in any needed information. Hit save once you are done.
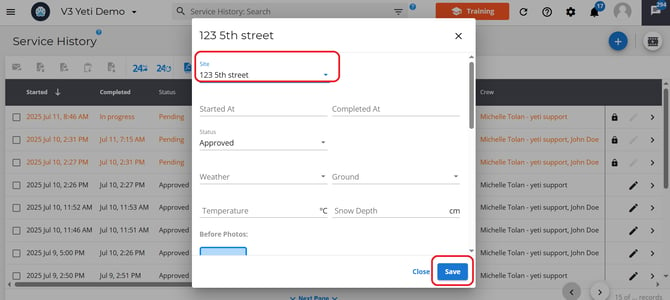
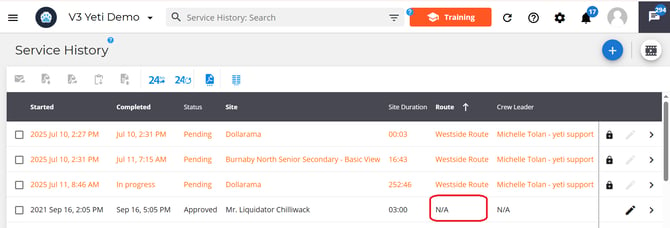
The record will mention it has been manually created.
It will show Route as ‘N/A’,
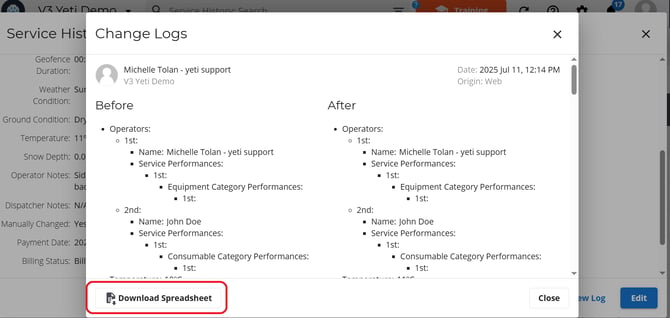
Viewing Your Log
To view the log for a record, click on the record and then select ‘View Log’.
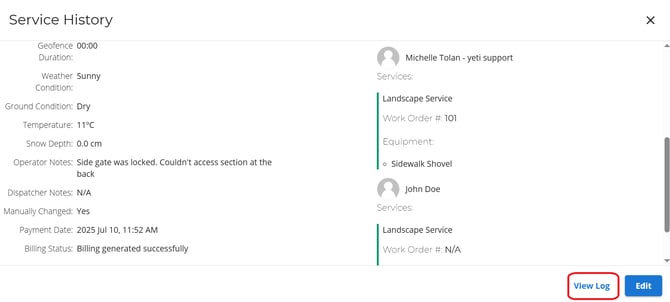
The View Log option allows you to see:
-
Who made changes
-
When the changes were made
-
What information was changed
Select the Download Spreadsheet to export the log data.
Set your PDF field configuration
For the PDF report, there is a single control button that lets you choose which fields are visible. You can enable or disable fields as needed, and your selections will apply both to your own PDF report and to the reports automatically sent to site contacts who are set up to receive the Service History Report after a site is completed or as part of a batch report. Learn more about site contact and reports here.
To set your PDF field, select the PDF configuration button.

Customize Column Display
Use the Column Configuration button to choose which columns are visible in the service history page and to set their display order. This configuration also determines how your service history data is exported as a spreadsheet.
Click the Column Configuration button.
 This will open a pop-up where you can assign numbers to fields to set their order. For example, entering 1 for Started At and 2 for Route will place Started At first, followed by Route.

To hide a column, click the eye icon next to it. Hidden columns will not appear on your view page or in exported spreadsheets.

Once you click save you will see your changes on service history page.

RouteWhen you select the export as spreadsheet option your column setting will control how your data is presented in the spreadsheet.

Column Available
| Started At | Completed At | Client | Client Reference | Route |
| Site | Site Address | Site Duration | Site Tags | Site Flagged |
| Service | Service Duration | Service Duration Decimal | Minimum Duration | Area |
| Crew Leader | Crew | User Tags | Operator Notes | Sub Contractor |
| Weather Condition | Ground Condition | Temperature | Snow Depth | Status |
| Equipment | Equipment Duration | Equipment Duration Decimal | Consumable | Time Zone |
| Geofence Times | Geofence Duration | Dispatcher Notes | Payment Date | Work Order # |
| Billing Status |
Export Options
There are five ways to export your service history data:
-
Send Selected Records as an Online Report – Generates an email with a link that displays the records in a browser. Online Report is the only way to export maps and their elements such as geofences and breadcrumbs operators.
Tip: This option is recommended for bulk reports.
-


-
Download Selected Records as a PDF – Downloads each record as an individual PDF in a compressed ZIP file.


-
Send Selected Records as a PDF – Sends a link via email to download the PDFs as a compressed ZIP file.


-
Download Selected Record Forms as a PDF – Downloads associated forms from records (e.g., Pre-Season Inspection) as PDFs. The PDF will show “No inspection forms found” if the record does not have any “Pre-Season Inspection Form”.


-
Download Selected Records as a Spreadsheet – Exports selected data to a spreadsheet (.xlsx) file.


You can choose what records you want to export by either:
- Selecting the checkbox beside the record.

- Use the search filter to group records together based on certain criteria.

Using Search Filters
You can use the search filter to find specific records or group records by certain criteria.
To filter your data:
-
Type directly into the search bar, or

-
Click the search filter icon at the end of the search bar.


A pop-up will appear with a list of fields you can filter by (such as site, route, or user).
Note: All records shown after applying a filter can be exported at once.
Exception Report
The Exception Report displays all Sites that have not been serviced in the past 24 hours. This report helps you monitor missed visits and manage the teams responsible for those Sites.
Select the Exception Report button.

Type in your timeframe and what email you want the report to be sent to. Hit send and the report will be sent to very email listed


Daily Exception Report
To receive this report automatically each day, use the Daily Exception Report feature.

Select the time you want the report to be sent each day and enter the email address(es) to receive it. Click Save when you're done.

To stop receiving the report:
Select the daily report button.
Clear the time field, or remove all email addresses from the list and hit save

Important Information About the Daily Exception Report
-
The report cannot be delivered if the company does not have an address, as the system is unable to determine the correct time zone.
-
The report will not be sent if the company has no Sites configured.
-
If all Sites are archived, the report will automatically stop being sent.
Time zones in Service History
Time zones can differ depending on how and where the report is viewed.
Here's how it works:
- Time Display in the Service History Report
In the Service History Report view within the platform, the Started and Completed times are shown in the user's time zone (your time zone).
- Time Display in Exported Reports
In both the Online Report and PDF Report, times are shown in the Site's time zone.
Setting the Site Time Zone
When creating or editing a Site, you'll see a Time Zone field.
The system automatically detects the time zone based on the Site address.
However, you can manually change this by editing the time zone field of a site.
Example: If your Site is located in British Columbia, Canada (Pacific Time), but you manually set it to Eastern Time, all exported reports will reflect Eastern Time.
Service History → Billing Report Workflow

If you are facing any issues with service history report, please reach out to Support@yetisoftware.com.